• SIMPLIFY. EXPAND. GROW.

    SIMPLIFY. EXPAND. GROW.

    SMB. CORE MIDMARKET. UPPER MIDMARKET. ECOSYSTEM
    LEARN MORE
  • ARTIFICIAL INTELLIGENCE

    ARTIFICIAL INTELLIGENCE

    SMB & Midmarket Analytics & Artificial Intelligence Adoption
    LEARN MORE
  • IT SECURITY TRENDS

    IT SECURITY TRENDS

    SMB & Midmarket Security Adoption Trends
    LATEST RESEARCH
  • CHANNEL PARTNER RESEARCH

    CHANNEL PARTNER RESEARCH

    Channel Partner Trends
    LATEST RESEARCH
  • FEATURED INFOGRAPHIC

    FEATURED INFOGRAPHIC

    2024 Top 10 SMB Business Issues, IT Priorities, IT Challenges
    LEARN MORE
  • CHANNEL INFOGRAPHIC

    CHANNEL INFOGRAPHIC

    2024 Top 10 Partner Business Challenges
    LATEST RESEARCH
  • 2024 TOP 10 PREDICTIONS

    2024 TOP 10 PREDICTIONS

    SMB & Midmarket Predictions
    READ
  • 2024 TOP 10 PREDICTIONS

    2024 TOP 10 PREDICTIONS

    Channel Partner Predictions
    READ
  • CLOUD ADOPTION TRENDS

    CLOUD ADOPTION TRENDS

    SMB & Midmarket Cloud Adoption
    LATEST RESEARCH
  • FUTURE OF PARTNER ECOSYSTEM

    FUTURE OF PARTNER ECOSYSTEM

    Networked, Engaged, Extended, Hybrid
    DOWNLOAD NOW
  • BUYERS JOURNEY

    BUYERS JOURNEY

    Influence map & care-abouts
    LEARN MORE
  • DIGITAL TRANSFORMATION

    DIGITAL TRANSFORMATION

    Connected Business
    LEARN MORE
  • MANAGED SERVICES RESEARCH

    MANAGED SERVICES RESEARCH

    SMB & Midmarket Managed Services Adoption
    LEARN MORE
  • WHITE PAPER

    WHITE PAPER

    SMB Path to Digitalization
    DOWNLOAD

Techaisle Blog

Insightful research, flexible data, and deep analysis by a global SMB IT Market Research and Industry Analyst organization dedicated to tracking the Future of SMBs and Channels.
Anurag Agrawal

Manageability drives SMB mobility solution supplier evaluation, especially in Midmarket

Techaisle’s 2015 SMB and Midmarket Mobility Adoption study shows that to emerge as leaders in the mobility solution market, suppliers will need to tailor their offerings and strategies to specific clusters within the SMB market. Successful suppliers will need to be cognizant of, and visible in addressing, key SMB selection criteria.

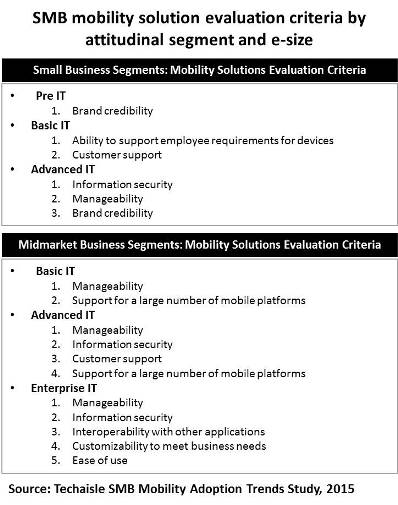
Figure below presents an analysis of SMB mobility solution evaluation criteria, tied to the attitudinal groups used for SMB segmentation analysis. This segmentation and perspective highlights how increased sophistication changes the requirements that SMB users have of suppliers.
techaisle-smb-mobility-solution-evaluation-criteria-image 

Small Business Segments
Within the small businesses, the Pre-IT segment is looking first and foremost for a trusted brand. These small business buyers opt for horizontal suppliers for their first step into mobility solutions. Data from other segments suggests that increasing sophistication leads to more exacting expectations.

Basic IT buyers are looking for help with managing BYOD and for effective customer support, while Advanced IT buyers look for assurances of information security, for manageability, and for suppliers’ credible brands.

Midmarket segments
“Manageability” is the most essential attribute for suppliers targeting midmarket firms. The basic IT segment is looking for assistance in supporting a large number of mobile platforms as a means of dealing with the BYOD needs of a larger (relative to small business) workforce, and/or as a means of supporting customer access to public systems.

The midmarket Advanced IT group, like its small business peers, requires a combination of manageability and information security, and adds customer support and the requirement for multi-device/platform support.

The enterprise IT group –the largest spenders represented in this chart – have a few unique requirements. This group demands interoperability and customizability as it seeks to integrate mobility solutions within the broader IT infrastructure, and looks as well for ease of use as it rolls out mobility solutions to a (relatively) large and diverse workforce. Techaisle expects that over time, an increasing number of SMBs will pursue these capabilities as they, too, tie mobility into their overall IT/business architectures.


Anurag Agrawal

Mobility is Strategic for 13 percent of SMBs - Meet "Aggressive Adopters" Segment

techaisle-smb-infographic-mobility-segmentationTechaisle’s SMB Mobility adoption research and corresponding segmentation shows that there are three distinct SMB segments of mobility solution users.

Aggressive Adopters: Mobility is Strategic to their business; these form 13 percent of SMBs

Steady Movers: Mobility is enabled in their business; by far the largest segment at 49 percent of SMBs

Fence Sitters: Mobility is a convenience for their business; these form 19 percent of SMBs

It is imperative for IT Vendors and channels to understand the segments' different attitudes towards mobility, current and planned usage of mobility and firmographics to create an actionable marketing strategey. For example, Techaisle’s SMB Mobility Segmentation shows that for 13 percent of SMBs that fall into the Aggressive Adopters segment mobility is strategic to their business growth and survival. A deep understanding of the three segments will help IT vendors and channel partners identify their target markets and how to sell into them.

Sales Strategies for SMB Mobility Segments

techaisle-smb-mobility-segments-1

Even in terms of spending, aggressive adopters are spending a higher percentage of their IT budget on mobility solutions. Interestingly, Fence Sitters are spending comparatively higher percentage on mobility consulting assessments looking for advice on the most appropriate solutions before adopting mobility enterprise-wide.

BYOD Policy and Use of Tablets & Smartphones

Not only Aggressive Adopters were the first to use tablets and smartphones but they also have the highest density (mobile devices per employees) and highest average number of tablets and smartphones being used at all employee size levels among all three segments.

techaisle-smb-mobility-segments-2

There are twice as many SMBs in the Aggressive Adopters segment as Fence Sitters that use Tablets and Smartphones.

Aggressive Adopters have also moved quickly to implement a BYOD policy whereas a large percentage of Steady Movers do not have a BYOD policy but they also do not stop their employees from using their own devices.


techaisle-smb-mobility-segments-3

Aggressive Adopters also have a very healthy attitude towards employees using consumer applications at work as they feel it is a good way to learn about technology that their employees find useful and can be officially integrated into their business.


techaisle-smb-mobility-segments-4


Adoption of mobility solutions has also led to a positive effect on work-life balance of their employees. Aggressive Adopters have also seen improved productivity, higher employee satisfaction and improved quality of work.


With improved productivity and quality of work there will be a continued proliferation of mobile devices and corresponding solutions that will drive new forms of collaboration of content and communication. As devices become increasingly small, smart, connected and powerful, the server and network become less visible progressively moving offsite both physically and from a management perspective, simultaneously serving more computing power, storage and bandwidth; mobility will revolve around collaboration delivered through an enhanced browser. Therefore, todays Aggressive Adopters will look for integration of communication channels, content and workflow as the foundation on which to build their strategic mobile solutions.


The responsibility lies with the IT Vendors and their channel partners to effectively mine the Aggressive Adopters’ segment at the same time using realized proof points to move each of the other two segments (Steady Movers and Fence Sitters) to the Aggressive Adopter segment.

In terms of market opportunity, Aggressive Adopters show the highest growth rate for mobility spending requiring sophisticated solutions whereas Steady Movers have the biggest size due to sheer volume of SMBs falling into the category.

Dr. Cooram Ramacharlu Sridhar

What is the big deal with ANN?

In the thirty years from the time Shunu Sen posed the marketing-mix problems, I have been busy with marketing research. I tried modeling most of the studies and discovered that market research data alone is not amenable to statistical predictive modeling. Take for example, imagery. Is there a correlation between Image parameters and Purchase Intention scores? There should be. But rarely does one get more than a 0.35 correlation coefficient. Try and link awareness, imagery, intention to buy, product knowledge, brand equity, etc. to the performance of the brand in the market place and one discovers land mines, unanswered questions and inactionability.

This is where ANN steps in.

Technically ANN (Artificial Neural Networks) offers a number of advantages that statistical models do not. I will list a few of them.

    1. Non-linear models are a tremendous advantage to a modeler. The real world is non-linear and any linear model is a huge approximation.


    1. In a statistical model, the model gives the error and one can do precious little to decrease the error. In ANN one can specify the error tolerance. For example we can fit a model for 85, 90, 95 or 99% error. It requires some expertise to figure out whether there is an over fit and what is the optimum error one can accept.


    1. Statistical models make assumptions on distributions that are not real in the real world. ANNs make no distribution assumptions.


    1. Most ANN software available today do not identify the functions that are fitted. We, on the other hand, have been able to identify the functions that are fitted and how to extract the weights and build them into an algorithm.


How do we bring the differentiation?

Our biggest strength is in data integration that combines market research and economic data with transaction data into a single file. This is tricky and requires some ingenuity. We use Monte Carlo techniques to build these files and then use ANN for building the Simulation models. Optimization then becomes clear and straight forward since we do not use statistical models. Optimization using statistical modeling, which most modelers use, is a nightmare. Most of the large IT vendors and even analytics companies continue to use statistical modeling for Optimization. And therein lays the problem. Neither are these companies aware of the possibilities that ANN can provide. Most modeling is done using aggregate data, whereas we handle the data at the respondent level. The conventional modeling is macro data oriented whereas we are micro data oriented. Hence the possibilities that we can generate with micro data for modeling is huge, compared to macro data.

We have crossed the stage of theories. There are many projects that we have executed successfully that have gone on to become a must-have analytical marketing input mechanism.

Doc
Techaisle

Dr. Cooram Ramacharlu Sridhar

Brand Market Modeling Solution Delivers 85-95% Accuracy

What is the market mix problem that I keep talking about that has stayed unsolved for so many years. The problem by itself is simple: How much does my brand sell for different marketing inputs? A regression model needs historical data of at least three years. Most companies either do not have that much data, or the markets have changed in three years and hence the data is pretty much useless. In addition, regression models cannot accommodate changes in product formulation or advertising campaign changes. Further, economic data like GDP, CPI and inflation can never be built into the regression model. Hence all statistical modeling leads you up a cul-de-sac.

Brand LoyaltySo what did I do that was so different? I went back to market research data. Almost all companies do advertising or brand tracking. The sample sizes in these tracks vary from 800 to 4000, every month. The tracks capture primarily the exposure to media, awareness of advertising and the brands, brand imagery and Intention to buy. They set up benchmarks against each parameter and take marketing decisions. For example: if the claimed exposure to TV in April is 30% and it was 40% in March, they call the advertising agency and ask them to change the channels. If the imagery is not improving then they will change the advertising. These decisions are ad hoc, because they have no clue on how each of these decisions will affect a priori. The marketing guy’s knowledge is always from hindsight. So, what we did was to pick up the brand track data with 800 or 4000 respondents and modeled it. The basic modules were:

    1. Exposure to Awareness Model


    1. Awareness to Image Model


    1. Image to Intention to buy Model


    1. Intention to buy to actual sales model


With this approach we had solved one two problems: The requirement of long history of the brand’s performance and the irrelevance of historical data to the current scenario. We could take the brand track data from April and model it for May. Nothing can be more recent than this.

Now came the tricky part. How does one link media and other marketing inputs. This was done through a heuristic algorithm. Each respondent in the track was assigned a value for each marketing input. Now we had a file with track and inputs in each record. After this it was easy to integrate all other data. Once we had all the data together the independent modules were built using ANN and a dash-board was designed to make life easy for the user.

What were the results? Based on each month’s inputs we estimated the sales. What we could deliver was 85-95% accuracy of forecasts compared to the company’s sales-out figures. This far exceeded the original mandate to deliver a solution that gave 75% accuracy.

How does this help the brand managers? Here is a list.

    1. Understanding of the brand characteristics using the tabulator cuts down the time of extracting information from different sources by 80%.


    1. Simulate the brand response to variations in brand inputs to get the optimum response.


    1. If there is a competition activity in the market it is possible to check what investments should they make to reduce the effect of these activities on their own brand.


    1. Use the simulator during brand and advertising reviews.


Our Brand Modeling solution is a huge help in effective planning of a brand to meet the targets. With our unique Brand Modeling Solution a 30-year-old problem that brand marketers have been grappling with was put to rest. We have a successful solution.

Dr. Cooram Ramacharlu Sridhar (Doc)
Techaisle

Research You Can Rely On | Analysis You Can Act Upon

Techaisle - TA